
iMapBuilder - Interactive Map Software
![]()
![]()
Help Topics:
Getting Started
- Installation guide
- Interface Introduction
- Create an interactive map
- Map properties
- Styles and color theme
- Tooltip
Draw on map
- Add marker
- Draw line
- Draw route
- Add label
- Add clickable area
- Insert image or add logo
- Edit multiple objects
Software Features
- Area color and link settings
- Create heat map
- Map with legend
- Category filter for markers
- Highlight and group areas
- Import city to an interactive map
- Pan and zoom function
- Default zoom level and center point
- Batch edit region settings
Publish to the web
Embed map into blog or CMS
Plot latitude and longitude
Example of use
- Create population density heat map
- Clickable image map
- Create a drill down map
- Create World map
- Create U.S. map
License and registration
Create a heat map
A heat map is a geographical presentation of data in numerical values using colors. Such kind of map is heavily utilized to visualize the location-based data by highlighting trends and distributions across a geographic area. For example, a heat map can track the Swine Flu outbreaks throughout the world, to let people know how the disease is spreading so as to avoid visiting those places.
- Click the tick icon to enable heat map function on the sidebar. Click settings button to edit the heat map options.

- Select a heat map type.

Heat map type Continuous color: A gradient is generated base on two colors
(start and end);
Discrete range color: Any colors can be used at different data ranges.Highlight setting The color shows when highlight (mouseover) a region.
Continuous color heat map

You can select the start and end color of the heat map. Start color will be shown in the region which is assigned with lowest value while end color will be shown in the region which is assigned with highest value.
Discrete range color heat map

- Click Range and Color Setting Button. Click add.
- Enter the range limits.

-
The range of color in different values will be listed in define range color.
- After the range of color is defined, you can change the gradient colors using the gradient generator (lowest color and highest color) from the color picker. And Generate.

- If you want to change some range of color, you can manually click on that range and select other color.

- Click ok, insert data value for regions. Click apply and the heat map would be generated.

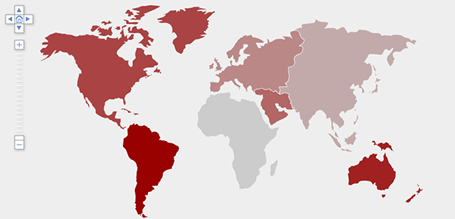
Example Map
You can see different levels of color gradient in different regions. As we use deep orange to represent maximum value and grey to represent low value, the region with the largest value (i.e., Middle East) is displayed in deep orange and Europe with -40 value shows grey color, while those in between are shown with colors that lie in between the two extreme colors.
Besides, as the South America and Oceania is value 5,6 which is included in the color range value 0-20, so the regions are color in blue.

How to Copy and Paste Heat Map Data from spreadsheet
- Open your spreadsheet software (like Excel or OpenOffice).
- Click Copy all to clipboard to copy the heat map data into clipboard.
- Switch to spreadsheet software and create a new blank spreadsheet.
- Paste the clipboard data into your spreadsheet.
- Edit the heat map data inside your spreadsheet software.
- Select the related cell in your spreadsheet and copy the data back into clipboard.
- Switch to the iMapBuilder Software, and click Paste from Clipboard to paste back the heat map data from spreadsheet.
- PS: Paste or Import should include the header title with same number of rows and columns .

How to Import and Export Datafile
- The data file is in Unicode Text (.txt), you can find this file format in Excel.
- Click the Export Data File to export the existing heat map data.

- Open data file in spreadsheet like Excel or OpenOffice (For OpenOffice, we recommend you to rename the datafile to .csv extension because OpenOffice may default open the .txt in it's OpenOffice Docs).
- Edit the heat map data in the spreadsheet software.
- Save the data file,
click here to view steps of using Excel or OpenOffice to save datafile.
What is Unicode Text Format (.txt) ?
- UCS-2 Little Endian (known as UTF16 LE).
- Each record is one line of the text file.
- Each field value of a record is separated by a TAB.
- And Text delimiter set as blank.